
MARCH 10 2022 / SUZANNE NOUKAHOUA
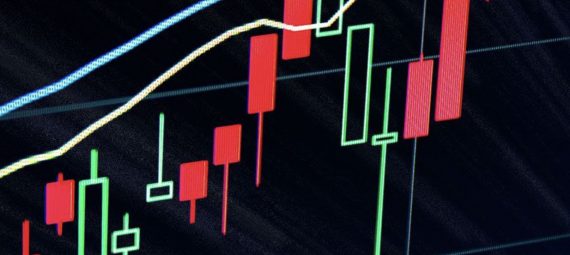
A very powerful part of candlesticks are the upper and lower wicks, and the long wicks we’ve been seeing on the higher timeframe Index charts tell us a lot about wider current market psychology.
A reversal? Or not? That’s the money-making question!
Long upper or lower wicks on a candlestick on a daily, weekly or monthly timeframe have been used as a sign of reversing market sentiment. Are we seeing that now?

During very Bullish seasons, like in 2020, when we saw a long upper wick on a weekly candlestick it should have given us pause about the trend continuing. However, since the bullish trend was so strong, those upper shadows really only indicated that the Bulls had taken a break, but we would certainly need confirmation to believe a long-term trend was reversing!
The opposite is also true, during bearish cycles, like we’re having now, we often see days or weeks with a very long lower wick and many newer traders take that immediately as a reversal signal and buy the dip, but this can be a death sentence for your short term trading account.
The current markets are made up of many competing, defeating and compounding negative factors. At the moment inflation is extremely high globally, there is war in Ukraine, commodities and oil prices are soaring, and there are global ongoing supply chain and chip shortage issues. All of these factors together are pushing commodities, utilities, staples and oil prices ever higher, BUT they’ve been sinking sands for the growth section.
Therefore, we need to be diligent not to expect that after major drops below key support areas, that any bullish action following is sustainable.
It very well might not be. Until a clear reversal is in, protect your gains by not giving them away by buying into long wick days.